- R 100%
| Filename | Latest commit message | Latest commit date |
|---|---|---|
| .github/workflows | ||
| docs | ||
| resources | ||
| results | ||
| .gitignore | ||
| main.R | ||
| README.md | ||


🐄 Proof-of-concept producer's share of the consumer's price
Effortlessly automate data processing and visualization with this cutting-edge proof-of-concept pipeline.
Note
This GitHub repository is used as a proof-of-concept and does not aim to produce any official statistics for the federal office for agriculture.
🎯 Goal of this project
The goal of this project is to develop and test a proof-of-concept (POC) data pipeline that involves the following steps:
- Data querying: An R script, executed via GitHub Actions, queries the data from LINDAS using SPARQL. The Federal Office for Agriculture (FOAG) already uploads current market data to the Linked Data Service (LINDAS).
- Computation: The script calculates the producer's share of the consumer's price and performs a seasonal decomposition. The results are stored on this public GitHub repository.
- Visualization: The results are visualized using Datawrapper, which generates an interactive chart embedded in an HTML page.
📁 The repository structure
This repository is structured as follows: /docs contains all files related to generate the demonstration sites -- both the HTML files as well as the markdown source files. /resources contains the SPARQL scripts used, sourced R functions and any other resources needed here. /results contains any data written by the R script; i.e., its output.
🤖 The tech stack
This project makes use of the following technologies and programming languages.
- LINDAS: A linked data service for publishing data as knowledge graphs. It can be queries by SPARQL, a query language and protocol for linked open data on the web.
- R: A language for statistical computing.
- GitHub Actions: A CI/CD platform that allows to automate code execution.
- Datawrapper: A no-code tool to create and displays interactive visualizations.
📓 Process documentation
This project involves two periodically executed processes: the GitHub Actions workflow (once a week) and the Datawrapper update (once an hour). Below is a detailed description of the process, with reference to the actual step numbers from the sequence diagram.
sequenceDiagram
    autonumber
    participant LINDAS
    participant R Script
    participant GitHub
    participant Datawrapper
    loop Every week
        activate GitHub
        GitHub->>GitHub: Set up environment
        GitHub->>R Script: Trigger execution
        activate R Script
        R Script->>LINDAS: Send SPARQL query
        activate LINDAS
        LINDAS-->>R Script: Return milk data
        deactivate LINDAS
        R Script->>R Script: Calculate producer's share
        R Script->>R Script: Decompose time series
        R Script->>GitHub: Save results
        deactivate R Script
        GitHub->>GitHub: Commit results
        deactivate GitHub
    end
    opt When chart is loaded
        activate Datawrapper
        Datawrapper->>GitHub: Fetch latest results
        Datawrapper->>Datawrapper: Visualize results
        deactivate Datawrapper
    end
- Set up environment: GitHub Actions sets up the environment, installing R and the necessary packages
httras well asreadr. - Trigger execution: GitHub Actions triggers the execution of the R script (
main.R). - Send SPARQL query: The R script sends a SPARQL query to LINDAS via the API to retrieve the latest market data.
- Return market data: LINDAS processes the query and returns the up-to-date milk data to the R script.
- Calculate producer's share: The R script computes the producer's share of the consumer's price based on the returned data.
- Decompose time series: The R script performs a seasonal decomposition of the time series by LOESS (locally estimated scatterplot smoothing) using the
stlfunction from thestatspackage. - Save results: The processed results are written as two CSV files (
prices.csvandproducers-share.csv) to the/resultsdirectory. - Commit results: GitHub Actions commits the results to the repository. If no changes are detected, no commits are made.
- Fetch latest results: Whenever a chart is loaded, datawrapper fetches the latest CSV file from GitHub.
- Visualize results: Datawrapper creates and updates an interactive graphic at a fixed URL, reflecting the latest processed data. A demo of the datawrapper visualizations can be seen here. Note that the Datawrapper visualization is integrated in this webpage as an iframe.
🖥️ The GitHub Actions workflow
The GitHub action is controlled by the yaml file .github/workflow/compute-producers-share.yml. The action is scheduled to run every Sunday at midnight UTC, but it can also be trigerred manually.
name: Execute R script
on:
  schedule:
    - cron: '0 0 * * 0' # This runs the action every Sunday at midnight UTC
  workflow_dispatch: # This allows the workflow to be triggered manually

jobs:
  compute-producers-share:
    runs-on: ubuntu-latest
    steps:
      - name: Set Up R
        uses: r-lib/actions/setup-r@v2
      - name: Install packages
        uses: r-lib/actions/setup-r-dependencies@v2
        with:
          packages: |
            any::httr
            any::readr
      - name: Check out repository
        uses: actions/checkout@v3
      - name: Compute producer's share
        run: Rscript -e 'source("main.R")'
      - name: Commit results
        run: |
          git config --local user.email "actions@github.com"
          git config --local user.name "GitHub Actions"
          git add .
          git commit -m 'Data updated' || echo "No changes to commit"
          git push origin || echo "No changes to commit"
📈 Creating a chart with Datawrapper
Using Datawrapper is quite straightforward. The service can be used for free via a GitHub account.
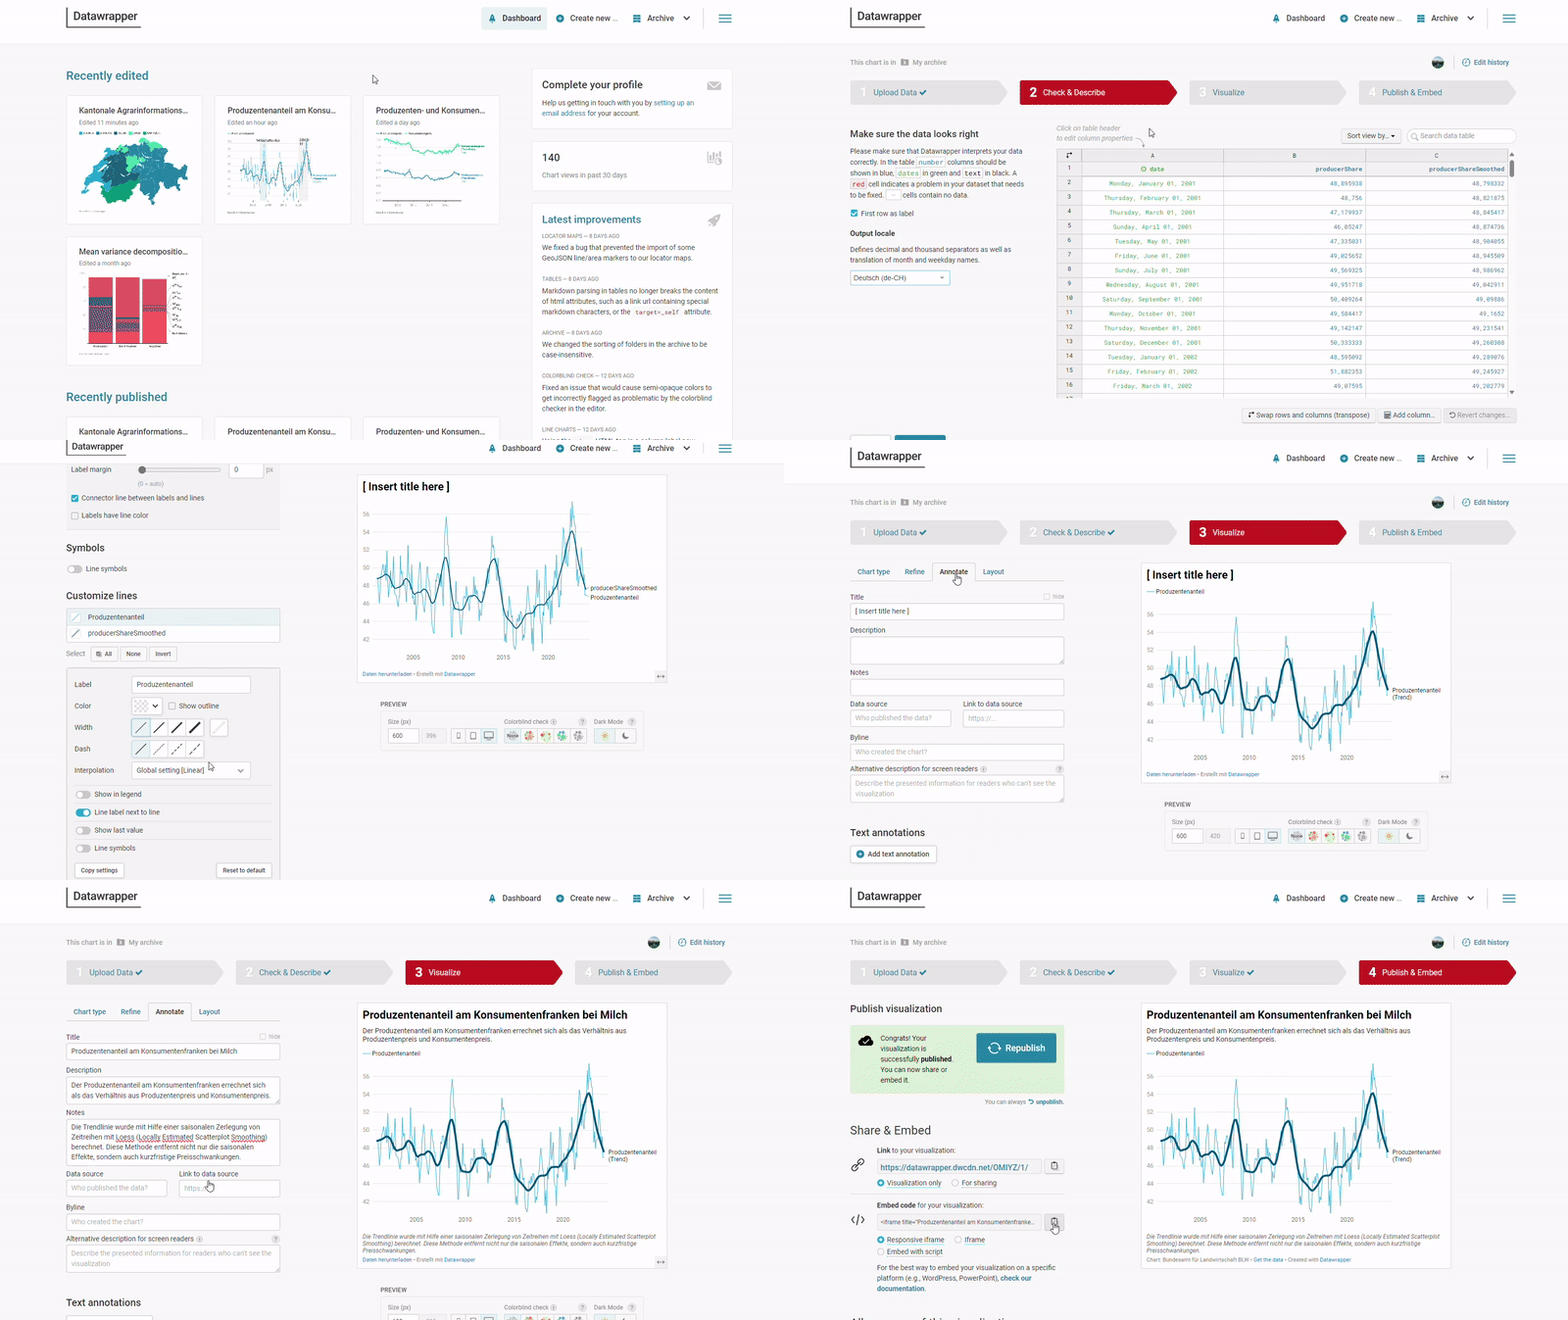
First, the URL from which the data will be fetched is set. Then, the graphic is customized to meet visualization needs.